Summary
- While growth stocks are trading at 31x forward earnings and the S&P almost 20, anti-bubble “anti-stupid” high-yield blue chips are available.
- Legal & General is an A-rated asset manager and insurance company trading at 6.5x earnings, priced for -4% growth, but actually growing at 5.2%.
- This anti-bubble blue chip is 38% undervalued, trading at a lower valuation than Mark Cuban gets on Shark Tank, and half the valuation private equity is paying.
- Looking for more investing ideas like this one? Get them exclusively at iREIT on Alpha. Learn More »
DNY59
This article was coproduced with Dividend Sensei.
You’re not alone if you’re frustrated by the market or confused by the economy.
After a terrifying 2022, 2023 has proven to be a year of whipsaws, AI-tech mania, and silliness.
But for the smart high-yield income growth investor, the playbook to a rich retirement is as proven and powerful as ever.
Safety and quality first, and sound valuation and prudent risk management always.
Let me show you why Legal & General Group Plc (OTCPK:LGGNY) is one of the best deep value 8% yielding options on Wall Street.
This is an anti-bubble, steadily growing A-rated asset manager that could help you achieve Buffett-like returns for years to come.
Why I Trust Legal & General And So Can You
Legal & General started as a UK insurance company in 1836. In 2019 it sold most of its insurance business to Allianz.
- 0% dividend withholdings on UK companies.
Today 58% of its business is asset management, and 42% is risk management, including the remaining insurance business, which management estimates will grow at 6% to 7% over time.
It has $1.5 trillion in assets under management, 32% of which is international.
LGGNY’s bond portfolio is highly conservative, with 76% invested in bonds, 99% of which are investment grade. LGGNY hasn’t had a portfolio bond default since 2008.
During the September 2022 mini-budget crisis in the UK, when 50-year UK bonds melted down 50% in 2 days, and the pension system almost collapsed, LGGNY was mostly unaffected.
The portfolio is 46% UK, 37% US, 10% Europe, and 7% the rest of the world.
It’s diversified across sectors and is heavily focused on infrastructure and stable cash flow assets.
- 16% infrastructure
- 15% utilities
- 15% consumer services
- 11% sovereign bonds
- 7% mortgages
- 6% tech
- 6% real estate
- 23% other.
If you’re worried about high exposure to UK bonds, don’t be. It’s 76% infrastructure bonds.
The BBB bond portfolio is made up of strong companies like Verizon, National Grid, Bayer, and Oracle bonds.
LGGNY has $20 billion invested in direct investments, mostly infrastructure and recession-resistant businesses like Tesco, water utilities, and windfarms.
This is how good their risk management is.
Since its founding, Legal & General has survived and thrived through the following:
- two world wars
- seven killer pandemics
- including the Spanish flu that wiped out 5% of humanity
- the Great Depression
- the Great Financial Crisis
- an unprecedented global lockdown.
This is a company built to last that will likely outlive us all.
Legal & General Credit Ratings
| Rating Agency | Credit Rating | 30-Year Default/Bankruptcy Risk | Chance of Losing 100% Of Your Investment 1 In |
| S&P | A Stable Outlook | 0.66% | 151.5 |
| Fitch | A+ Stable Outlook | 0.60% | 166.7 |
| Moody’s | A2 (A equivalent) Stable | 0.66% | 151.5 |
| AMBest | A Stable Outlook | 0.66% | 151.5 |
| Consensus | A Stable Outlook | 0.65% | 155.0 |
(Sources: S&P, Fitch, Moody’s, AMBest.)
Four rating agencies estimate the risk of this company going bust in the next 30 years at 0.65% or 1 in 155.
The bond market, the smart money on Wall Street, ignores the daily noise and focuses purely on fundamental risk, which has been rock steady all year.
LGGNY’s price can swing violently, but when the bond market and rating agencies aren’t worried, you should be either.
How confident are bond investors that LGGNY is a sound business that won’t fail? Its longest duration bonds are 41 years to maturity. Bond investors are willing to bet millions that LGGNY will still be around in 2064.
What about the looming recession? Legal & General is a UK-based asset manager, and here’s what economists expect from that economy.
- 19% of its business is overseas markets.
The UK is suffering through terrible stagflation, though things are expected to improve in the 2nd half of 2024.
Economists expect no recession, though the Bank of England still expects one.
So what does this mean for LGGNY?
| Metric | 2022 Growth | 2023 Growth Consensus | 2024 Growth Consensus | 2025 Growth Consensus |
| Sales | -21% | 32% | 32% | 32% |
| Dividend | 5% | 8% | 5% | 6% |
| Earnings | -4% | -2% | 11% | 15% |
| Book Value | 5% | 13% | 9% | 10% |
(Source: FactSet Research Terminal.)
LGGNY is expected to see a modest 2% decline in earnings this year and then experience double-digit rebound growth in 2024 and 2025.
Its book value and dividends are expected to keep growing at steady rates.
On July 5th, management reaffirmed its guidance, including:
- 4% to 7% earnings growth through 2024
- 3% to 6% dividend growth through 2024
- a 5% dividend hike for 2024.
Legal & General has a strong history of delivering on guidance, and its results have been fantastic over the last 11 years.
- 8% annual growth in book value per share
- 9% annual operating profit growth
- 11% annual growth in EPS and dividends.
LGGNY believes it is well positioned to take advantage of six major secular tailwinds.
- $149 trillion global asset management
- $57 trillion aging demographics
- $20 trillion addressing climate change
- $1.6 trillion welfare report in the UK
- $100 billion direct investments in UK’s infrastructure
- $30 billion for fintech innovation.
This represents a total of $228 trillion in megatrends that LGGNY says it can tap into to keep driving steady growth.
Is that growth the best among asset managers? No, it’s about half as fast.
But when earning a safe 8% yield, fast growth isn’t what you need.
Solid Growth Prospects
We’ve just seen how LGGNY has a solid history of steady growth and safe dividends. Management is confident it will hit its 5% dividend growth target in 2024, even with slowing economic growth and high recession risk.
But what about beyond 2024? What do analysts expect from Legal & General after that?
5.2% long-term growth is exceptional when you are getting paid a safe 8% yield.
| Investment Strategy | Yield | LT Consensus Growth | LT Consensus Total Return Potential | Long-Term Risk-Adjusted Expected Return |
| Schwab US Dividend Equity ETF | 3.6% | 9.70% | 13.3% | 9.3% |
| Legal & General | 8.0% | 5.2% | 13.2% | 9.2% |
| Nasdaq | 0.8% | 11.2% | 12.0% | 8.4% |
| Vanguard Dividend Appreciation ETF | 1.9% | 9.7% | 11.6% | 8.1% |
| REITs | 3.9% | 7.0% | 10.9% | 7.6% |
| Dividend Champions | 2.6% | 8.1% | 10.7% | 7.5% |
| Dividend Aristocrats | 1.9% | 8.5% | 10.4% | 7.3% |
| S&P 500 | 1.7% | 8.5% | 10.2% | 7.1% |
| 60/40 Retirement Portfolio | 2.1% | 5.1% | 7.2% | 5.0% |
(Source: FactSet Research, Morningstar.)
Yield and growth drive long-term returns, and if you want to achieve Buffett-like, Nasdaq-beating returns with minimal speculation, then ultra-yield is the way to go.
- Buffett’s unlevered returns are 12.8% for the last 58 years.
Historical Returns Since 2010
How many value stocks currently in a bear market have beaten the red-hot S&P for the last 13 years?
LGGNY has delivered 13.4% annual returns, slightly ahead of the S&P’s 13.2%, and that’s while its in a 38% bear market!
Its average rolling annual return is a market-smashing 16.3%, and from bear market lows, its returns have been Buffett-like.
LGGNY Best Returns Off Bear Market Lows Since 2010
| Time Frame (Years) | Annual Returns | Total Returns |
| 1 | 79% | 79% |
| 3 | 43% | 195% |
| 5 | 37% | 382% |
| 7 | 23% | 325% |
| 10 | 19% | 463% |
Warren Buffett’s returns over nearly 60 years are 20% annually. If you buy LGGNY in a bear market like this one, you can earn such returns for as long as a decade.
All while enjoying a safe 8% yield growing 5% over time.
Spectacular Value
LGGNY isn’t just undervalued; it’s anti-bubble undervalued.
| Metric | Historical Fair Value Multiples (12-Years) | 2022 | 2023 | 2024 | 2025 | 2026 | 12-Month Forward Fair Value |
| 13-Year Median Yield | 5.45% | $21.28 | $21.28 | $21.28 | $25.50 | $26.06 | |
| Earnings | 11.63 | $25.12 | $24.66 | $27.33 | $29.77 | $30.94 | |
| Average | $23.04 | $22.85 | $23.93 | $27.47 | $28.29 | $23.43 | |
| Current Price | $14.48 | ||||||
| Discount To Fair Value | 37.16% | 36.62% | 39.49% | 47.30% | 48.81% | 38.20% | |
| Upside To Fair Value (NOT Including Dividends) | 59.14% | 57.78% | 65.27% | 89.74% | 95.35% | 69.82% | |
| 2023 EPS | 2024 EPS | 2022 Weighted EPS | 2023 Weighted EPS | 12-Month Forward PE | 12-Month Average Fair Value Forward PE | Current Forward PE | |
| $2.12 | $2.35 | $0.98 | $1.27 | $2.24 | 10.4 | 6.5 |
According to Ben Graham, anti-bubble stocks trade at 8.5X or less cash flow or earnings.
That is a valuation so low that no growth is priced in…forever.
LGGNY is growing 5.2%, and double-digit growth is expected in 2024 and 2025.
Yet its currently priced for -4% growth and trading at an absurd 6.5X earnings.
How ridiculously cheap is this? In the first ten seasons of shark tank, the average deal was 7X earnings.
Buy LGGNY today, and you’re getting a deal that would make Mark Cuban proud;)
Today private equity, which strives for 12% to 20% long-term returns, is buying companies for about 11.5X earnings.
You can buy LGGNY with a safe 8% yield for about half that valuation.
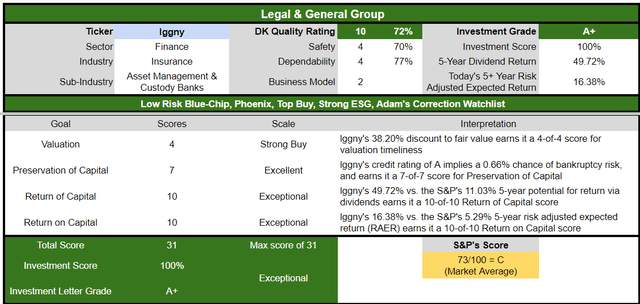
This 38% undervalued ultra-yield A-rated blue-chip is 38% undervalued and offers a 70% upside to fair value in the next year.
| Rating | Margin Of Safety For Low-Risk 10/13 Blue-Chip | 2023 Fair Value Price | 2024 Fair Value Price | 12-Month Forward Fair Value |
| Potentially Reasonable Buy | 0% | $22.85 | $23.93 | $23.43 |
| Potentially Good Buy | 20% | $18.28 | $19.15 | $18.74 |
| Potentially Strong Buy | 30% | $15.99 | $16.75 | $16.40 |
| Potentially Very Strong Buy | 40% | $10.97 | $14.36 | $14.06 |
| Potentially Ultra-Value Buy | 50% | $11.42 | $11.97 | $11.72 |
| Currently | $14.48 | 36.62% | 39.49% | 38.20% |
| Upside To Fair Value (Including Dividends) | 65.79% | 73.28% | 69.82% |
LGGNY is a potentially strong buy, and not far above its very strong buy price for anyone comfortable with its risk profile.
Risk Profile: Why Legal & General Isn’t Right For Everyone
There are no risk-free companies, and no company is right for everyone. You have to be comfortable with the fundamental risk profile.
Risk Profile Summary
- Regulatory/capital requirement risk
- “Reserves and our assessment of capital requirements may require revision as a result of changes in experience, regulation, or legislation.”
- “Changes in regulation or legislation may have a detrimental effect on our strategy.”
- Investment cyclicality risk
- “Investment market performance and conditions in the broader economy may adversely impact earnings, profitability, or surplus capital.”
- Counter-party risk
- “In dealing with issuers of debt and other types of counterparty, the Group is exposed to the risk of financial loss.”
- Disruption risk
- “New entrants may disrupt the markets in which we operate.”
- M&A execution risk (potentially overpaying for companies and executing poorly on integrating the acquisition)
- Talent retention risk (tightest job market in over 50 years)
- Data security risk: hackers and ransomware
- “A material failure in our business processes or IT security may result in unanticipated financial loss or reputation damage”
- Climate change risk
- “We fail to respond to the emerging threats from climate change for our investment portfolios and wider businesses.”
- Global Expansion Execution Risk (Now expanding into Europe and the U.S.).
LGGNY has a very robust risk management team. So good it hasn’t had a loss in its annuity portfolio since 2008.
However, in the short term, they are expecting an accounting hit from new regulatory changes in IFRS (International Financial Reporting Standards).
The $7 billion decline in shareholder equity won’t affect the dividend safety directly, though it will impact leverage ratios used by regulators.
LGGNY estimates its capital buffers are 225% above regulatory minimums even with the new regulations.
LGGNY estimates that the new accounting rules will have no impact on its expected 6% to 7% growth rate on its remaining insurance business.
- 42% insurance.
How do we quantify, monitor, and track such a complex risk profile? By doing what big institutions do.
Long-Term Risk Management Analysis: How Large Institutions Measure Total Risk Management
DK uses S&P Global’s global long-term risk-management ratings for our risk rating.
- S&P has spent over 20 years perfecting their risk model
- which is based on over 30 major risk categories, over 130 subcategories, and 1,000 individual metrics
- 50% of metrics are industry specific
- this risk rating has been included in every credit rating for decades.
The DK risk rating is based on the global percentile of a company’s risk management compared to 8,000 S&P-rated companies covering 90% of the world’s market cap.
LGGNY Scores 79th Percentile On Global Long-Term Risk Management
S&P’s risk management scores factor in things like:
- supply chain management
- crisis management
- cyber-security
- privacy protection
- efficiency
- R&D efficiency
- innovation management
- labor relations
- talent retention
- worker training/skills improvement
- customer relationship management
- climate strategy adaptation
- corporate governance
- brand management.
LGGNY’s Long-Term Risk Management Is The 151st Best In The Master List (63rd Percentile In The Master List)
| Classification | S&P LT Risk-Management Global Percentile | Risk-Management Interpretation | Risk-Management Rating |
| BTI, ILMN, SIEGY, SPGI, WM, CI, CSCO, WMB, SAP, CL | 100 | Exceptional (Top 80 companies in the world) | Very Low Risk |
| Strong ESG Stocks | 86 | Very Good | Very Low Risk |
| Legal & General | 79 | Good, Bordering On Very Good | Low Risk |
| Foreign Dividend Stocks | 77 | Good, Bordering On Very Good | Low Risk |
| Ultra SWANs | 74 | Good | Low Risk |
| Dividend Aristocrats | 67 | Above-Average (Bordering On Good) | Low Risk |
| Low Volatility Stocks | 65 | Above-Average | Low Risk |
| Master List average | 61 | Above-Average | Low Risk |
| Dividend Kings | 60 | Above-Average | Low Risk |
| Hyper-Growth stocks | 59 | Average, Bordering On Above-Average | Medium Risk |
| Dividend Champions | 55 | Average | Medium Risk |
| Monthly Dividend Stocks | 41 | Average | Medium Risk |
(Source: DK Research Terminal.)
LGGNY’s risk-management consensus is in top 37% of the world’s highest quality companies and similar to that of such other blue chips as
- Federal Realty Investment Trust (FRT) Ultra SWAN dividend king
- Illinois Tool Works (ITW) Ultra SWAN dividend king
- Home Depot (HD): Ultra SWAN
- Texas Instruments (TXN): Ultra SWAN
- Novo Nordisk (NVO): Ultra SWAN global aristocrat
The bottom line is that all companies have risks, and LGGNY is good, bordering on very good, at managing theirs, according to S&P.
How We Monitor LGGNY’s Risk Profile
- 17 analysts
- four credit rating agencies
- 21 experts who collectively know this business better than anyone other than management
- and the bond market for real-time fundamental risk-assessment updates.
When the facts change, I change my mind. What do you do, sir?”
– John Maynard Keynes.
There are no sacred cows at iREIT® or Dividend Kings. Wherever the fundamentals lead, we always follow. That’s the essence of disciplined financial science, the math behind retiring rich and staying rich in retirement.
Bottom Line: Legal & General Is One Of The Best Anti-Bubble Ultra-Yielders You Can Buy
Dividend Kings Automated Investment Decision Tool
Let me be clear: I’m NOT calling the bottom in LGGNY (I’m not a market-timer).
Even Ultra SWANs and aristocrats can fall hard and fast in a bear market.
Fundamentals are all that determine safety and quality, and my recommendations.
- over 30+ years, 97% of stock returns are a function of pure fundamentals, not luck
- in the short term; luck is 25X as powerful as fundamentals
- in the long term, fundamentals are 33X as powerful as luck.
While I can’t predict the market in the short term, here’s what I can tell you about LGGNY.
- safe 8% yield (3% risk of a cut in a severe recession) growing at 5.2% over time
- 13.2% long-term return potential vs. 10.2% S&P and 12.8% Buffett’s historical unlevered returns
- historically 38% undervalued
- 6.5X earnings (anti-bubble blue-chip)
- 70% upside to fair value within the next year
- 3X better risk-adjusted expected returns than the S&P 500 over the next five years
- 5X the income potential of the S&P over the next five years.
If you are tired of worrying about market valuations, you don’t have to sell everything and hide in cash.
Something wonderful is always on sale; take a look at Legal & General.
6.5X earnings and a safe 8% yield growing at 5%! From an A-rated company with very strong risk management and six megatrends expected to drive Nasdaq-beating 13.2% long-term returns.
Are you worried about the AI tech bubble? Do you refuse to buy into growth stocks averaging a PE of 31 going into recession when interest rates are still rising?
Good for you! You’re being anti-stupid!
But just because you don’t want to buy the S&P or other popular growth ETFs doesn’t mean you can be a Buffett-level stock market genius.
Buffett himself has said many times all it takes to achieve life-changing success is “wonderful companies at fair prices” held for the long-term.
Legal & General is one of the best blue-chip bargains on Wall Street.
A thriving ultra-yield name you can trust. One that could soar 70% in the next year, and it would merely return to fair value!
I don’t know about you, but in a market that’s crazy stupid, I think buying some Legal & General sounds pretty smart;)
Editor’s Note: This article discusses one or more securities that do not trade on a major U.S. exchange. Please be aware of the risks associated with these stocks.
Original Article: https://seekingalpha.com/article/4616397-legal-and-general-an-8-percent-yielding-anti-bubble-anti-stupid-blue-chip-bargain


